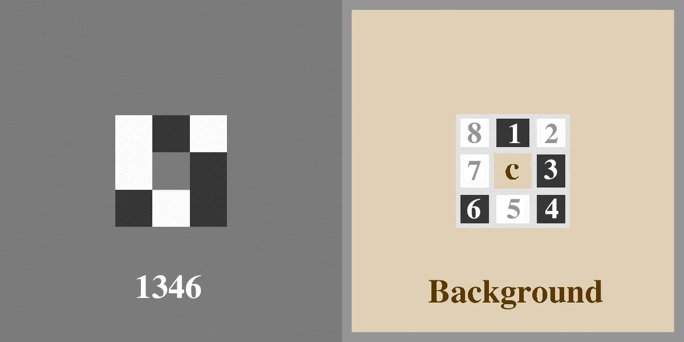
Figure 24.1 (left) The “1346” segmented test target; (right) diagram of the nomenclature . This display has 3% luminance in the 1, 3, 4, 6 segments, hence its name. The center [c] and the background were 17% maximum luminance. The surround was segmented into 8 elements, numbered clockwise starting at the top center. Each surround segment was either 100% or 3%.
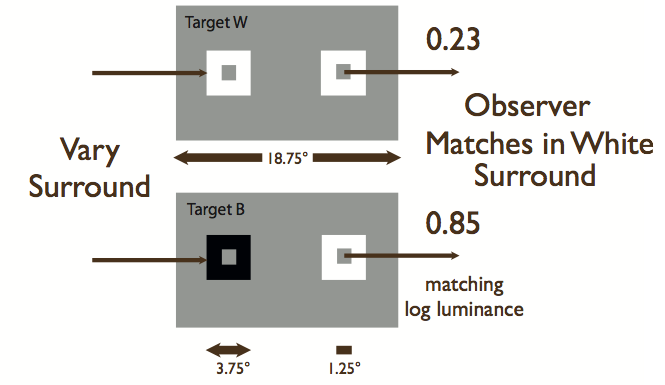
Figure 24.2 Segmented surround experiment.
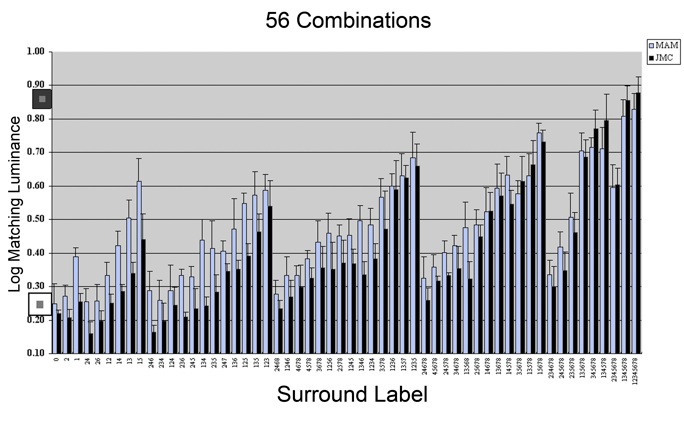
Figure 24.3 Matching data for all 56-surround arrays. The vertical axis plots the relative log luminance of observer’s matches. The icon for the all-white surround is placed at 0.23, and the icon for the black surround match is placed at 0.85 on the axis to illustrate the range of possible matches. The horizontal axis identifies the segmented surround. The data have been sorted so that the number of black elements increases from left to right. In each group the data is ordered by average log matching luminance.
[3600 by 2383 pixels] 24.3n.tif
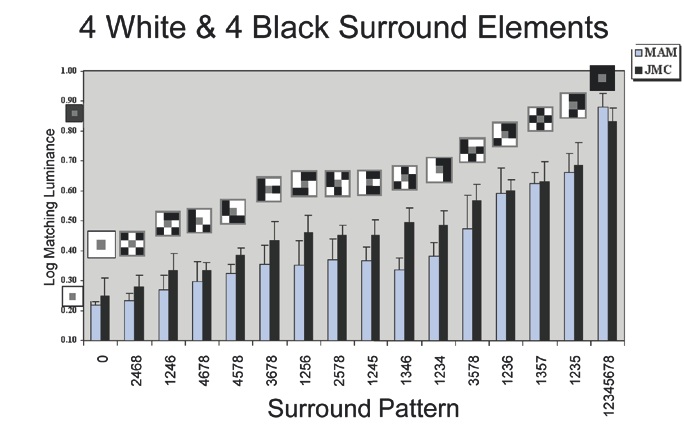
Figure 24.4 Matches for all the 4-white/4-black surround targets.
[1500 by 963 pixels] 24.4Nn.tif
This central gray square of this test target should be viewed at 1.25°.
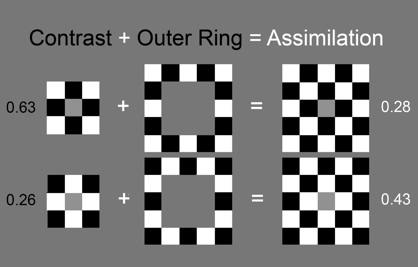
Figure 24.6 Central gray squares change from Contrast to Assimilation with the addition of
more checkerboard squares.
[1920 by 1260 pixels] 24.6.jpg
Wiley Figures

