Standard sRGB vs. RAW format
Color Space
Digital photography has become too easy. Cameras generate digital files for convenient display and digital manipulation. The pictures are almost always very attractive. It would be very convenient if the digital files were accurate records of the radiance information of the light that came from the scene. Although convenient, this assumption in is wrong. Standard photographs in sRGB format are nonlinear transformations of light captured by the sensor.
-
-
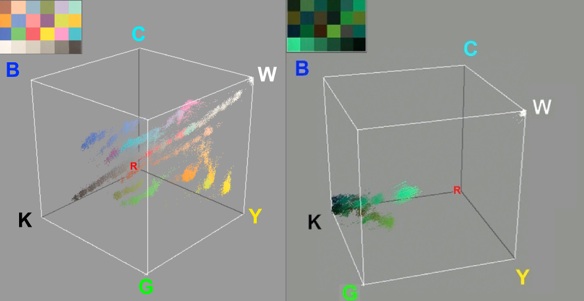
Fig. 1 (left) 3-D color renditions of ColorChecker® in Canon 60D digital photograph. It shows RGB digit plot of the 24 ColorChecker® squares taken from a standard camera image. The digits cover most of the volume of the output color space.
-
Fig. 1 (right) RGB digit plot of the 24 ColorChecker® squares taken from the same camera’s RAW camera image. The data was extracted from the RAW file using LibRAW algorithms [10,11], The digits cover only a cigar-shaped portion of the output color space.
-
-
The left side of Fig.1 is a 3-D plot of digital data for all 24 squares in the ColorChecker®. The digital response to the targets colored papers fills the RGB color cube. That is the digital color space that all display devices expect.
While these nonlinear digital transforms make beautiful pictures, they distort the linear digital data captured by the sensor.
Around the year 2000, camera makers introduced RAW data formats to allow access to data much earlier in the camera’s signal processing chain. RAW is a digital file of camera response data before the camera’s image enhancement firmware. There is no international standard for RAW. Each company provides a different software package that gives the photographer more control. However, this does not mean that all RAW images acquired this way are linear. The same nonlinear processes performed by the camera’s firmware are now performed in a computer, by the RAW reading software provided by the camera manufacturer. It is just that the photographer can choose manually which parameters to use, rather than automatic selection by the camera’s firmware engine.
RAW digits, extracted using LibRAW algorithms[1], are linear with respect to the sensor’s quanta catch. The volume in RGB linear color space is much smaller than that of the Jpeg image, even though they both were recorded with the same camera. Fig. 1(right) plots the linear RAW digits scaled to 8-bit RGB. As well, the entire volume of all 24 ColorChecker squares occupies a small cigar-shaped space. The innate sensor RAW response to all colors shows a very limited response to chroma, compared to the range of responses to white/black reflectances. Both CRF and LibRAW algorithms provide more linear scene data, compared to the standard sRGB output of cameras. Nevertheless, LibRaw data is linear with respect to scene radiance falling on the sensor. It can be used for arithmetic operations, while nonlinear-enhanced images (standard photography) cannot.[2]
-
[1] “LibRaw” Image Decoder Library, <http://www.libraw.org/>
-
[2] J. McCann, and V. Vonikakis, "Accurate Information vs. Looks Good: Scientific vs. Preferred Rendering", Proc.IS&T, Color in Graphics, Imaging, and Vision; Amsterdam 6, 231-238 (2012).
Is Chromaticity the signature of reflectance?
A good example of the influence of standard camera nonlinear transformation is found in calculating camera chromaticities. Fig. 2 is a photograph of multiple objects with identical matte surfaces in nonuniform illumination. Sunlight is the only light source so that the spectral distribution of the illumination is constant.
Figure 2 shows a pair of identical Jpeg photograph of oranges, lemons and limes in sun and shadow. The range of light in the scene slightly exceeds the range of the camera, however we have no difficulty identifying which fruits are oranges lemons and limes in the photographs.
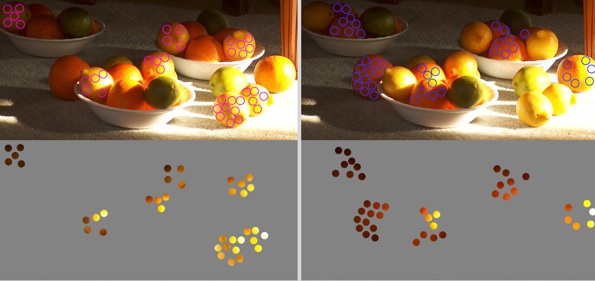
Figure 2 (left top) Magenta circles show lemon segments; (left bottom) show the same image segments viewed on a constant gray background.
Figure 2 (right top) Blue circles show orange segments; (right bottom) segments show the same image segments viewed on a constant gray background.
In Fig. 2 (left) we manually selected 38 circular image segments, all from lemons. They are identified in Figure 2 (left-top) by magenta circles and shown on a uniform gray background below. While the image segments appear to be normal lemons in the top image, we can see that the range of camera responses to lemons varies from white to black in a constant surround.
In Fig. 2 (right) we manually selected 42 circular image segments of oranges. They are identified in Fig. 2 (top right) by blue circles. These segments are shown on a uniform gray background below. The response to oranges covers the entire camera range from white to black in the constant surround.
We measured the average R, G, B camera digits for each lemon and orange image segment in the Jpeg image file. We wanted to compare the chromatic representation of the camera response to lemons and oranges: namely constant objects with constant surface reflectance in variable intensity illumination. We used camera chromaticity values (r,g) using the formulae:
r = R/(R+G+B)
g = G/(R+G+B),
with R, G, B equal to the pixel values taken for a particular color circle in the jpeg image file. These chromaticity values are specific to the camera system and file format. They should not be confused with colorimetric chromaticities (x, y) that represent camera independent transforms of X,Y,Z.
We plotted the (r,g) values of each segment in Figure 3.
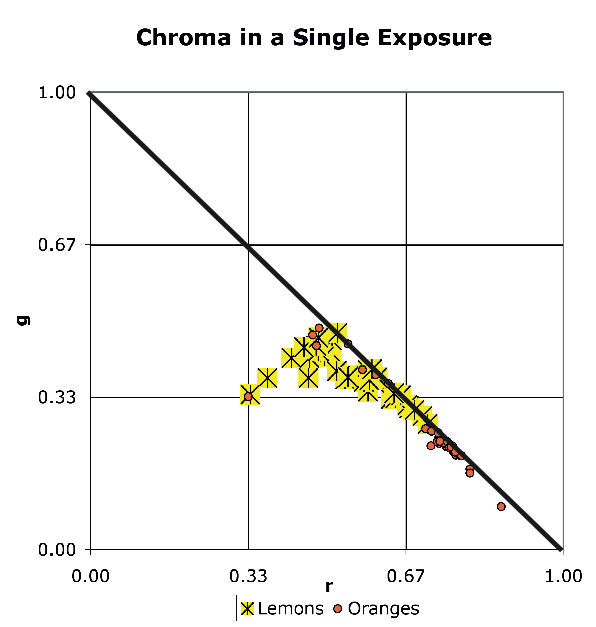
All possible chromaticities fall in the lower triangle. The perimeter of the triangle describes the locus of maxima chroma with R at the bottom right, G at the top left, and B at the bottom left. The maximum possible yellow (Y) falls half way between R and G at r = g = 0.5.
If chromaticity is a reliable signature of surface reflectance then all all lemons must fall on the same point in the chromaticity diagram. Likewise all orange chromaticity must fall on a different point in the diagram. When we study the data we see that:
-
• Over-exposed lemons and oranges both fell on the on the achromatic (0.33, 0.33) center.
-
• All other orange chromaticity values fall on the chroma limit line at 45°. They cover the range from Y to approach R.
-
• The lemon segments have some less than full chroma values, but overlap the orange segments with the exception of those near R.
Clearly these r, g chromaticity values from sRGB images do not represent the surface of the objects. Clearly, they cannot be helpful to the recognition of objects and scene characteristics, such as illumination. Constant object surfaces have highly variable digital signatures. The preferred rendering signal processing in this standard jpeg image file has transformed the spatial information from the scene. Constant surfaces in constant illumination spectra become highly variable chromaticities in bright light and shadows. In other words, standard camera renditions of scene colors change greatly in different amounts of light in the same scene under the same spectral illumination. Scientific image processing applications, such as object recognition and spatial HDR imaging, require accurate scene radiances. Attractive, but uncalibrated, images should be avoided.
However, if we replace standard (sRGB) images with LibRAW linear digit data, we avoid the problem. Calibrated linear data can be used in arithmetic calculations, such as chromaticity. LibRAW data has shown that chromaticity correlates with surface reflectance, but only in constant spectral illumination.[2]
